6. Read Head Information Readout and Program Update
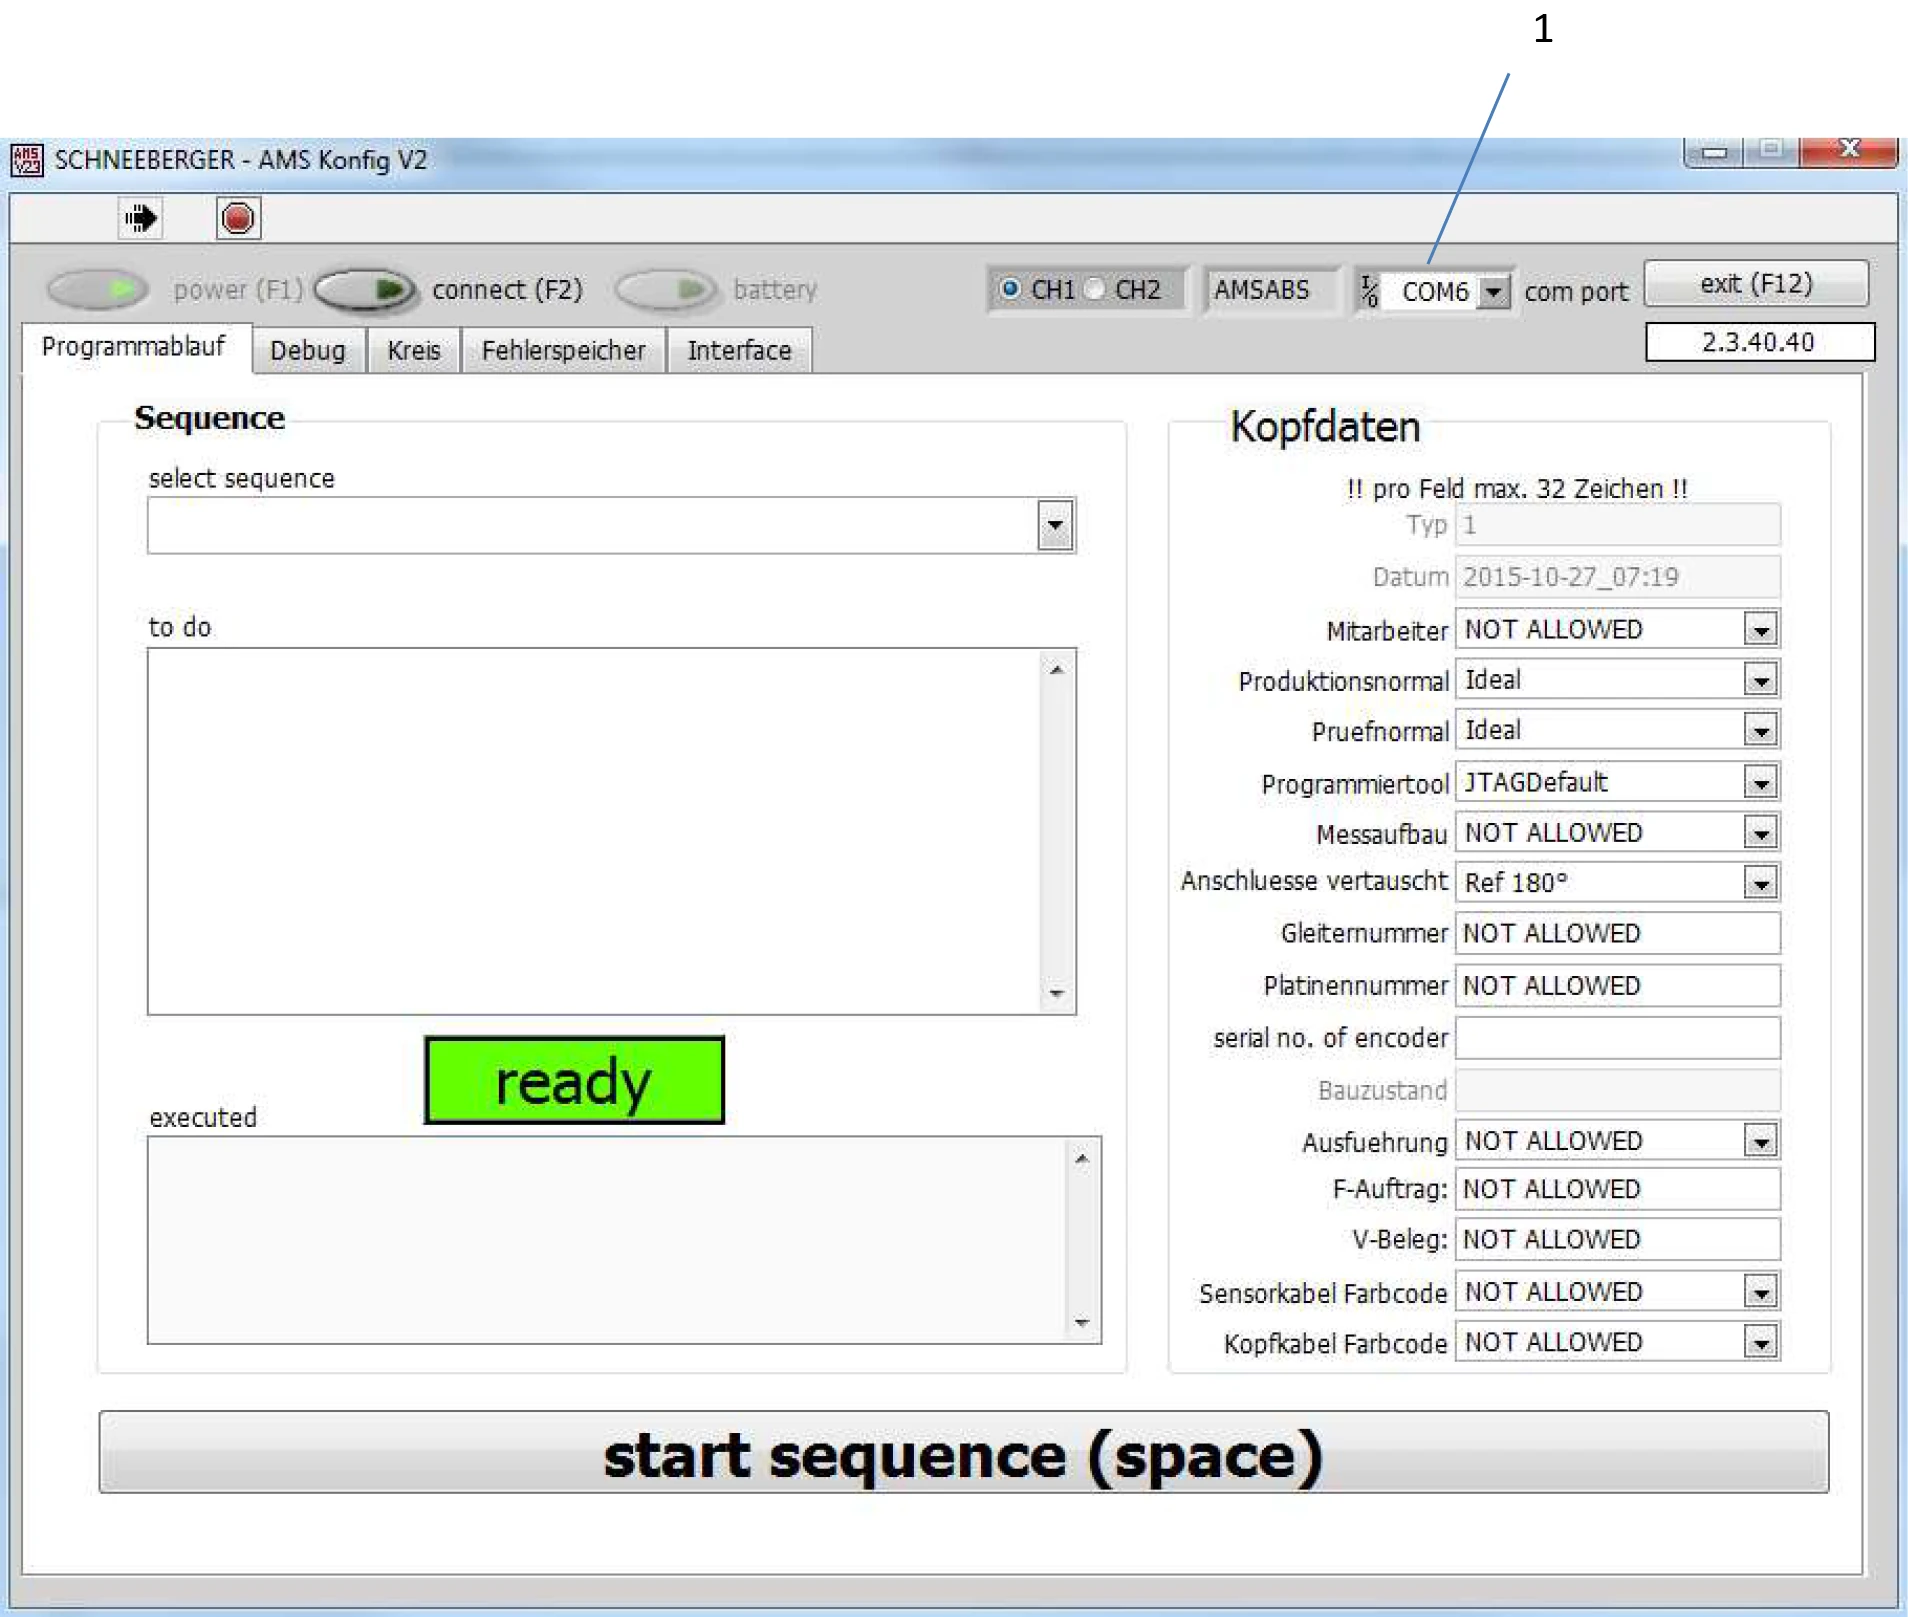
In order to read data, the Com interface (1) must be selected.
6.1.1 Reading the Read Head Error Memory
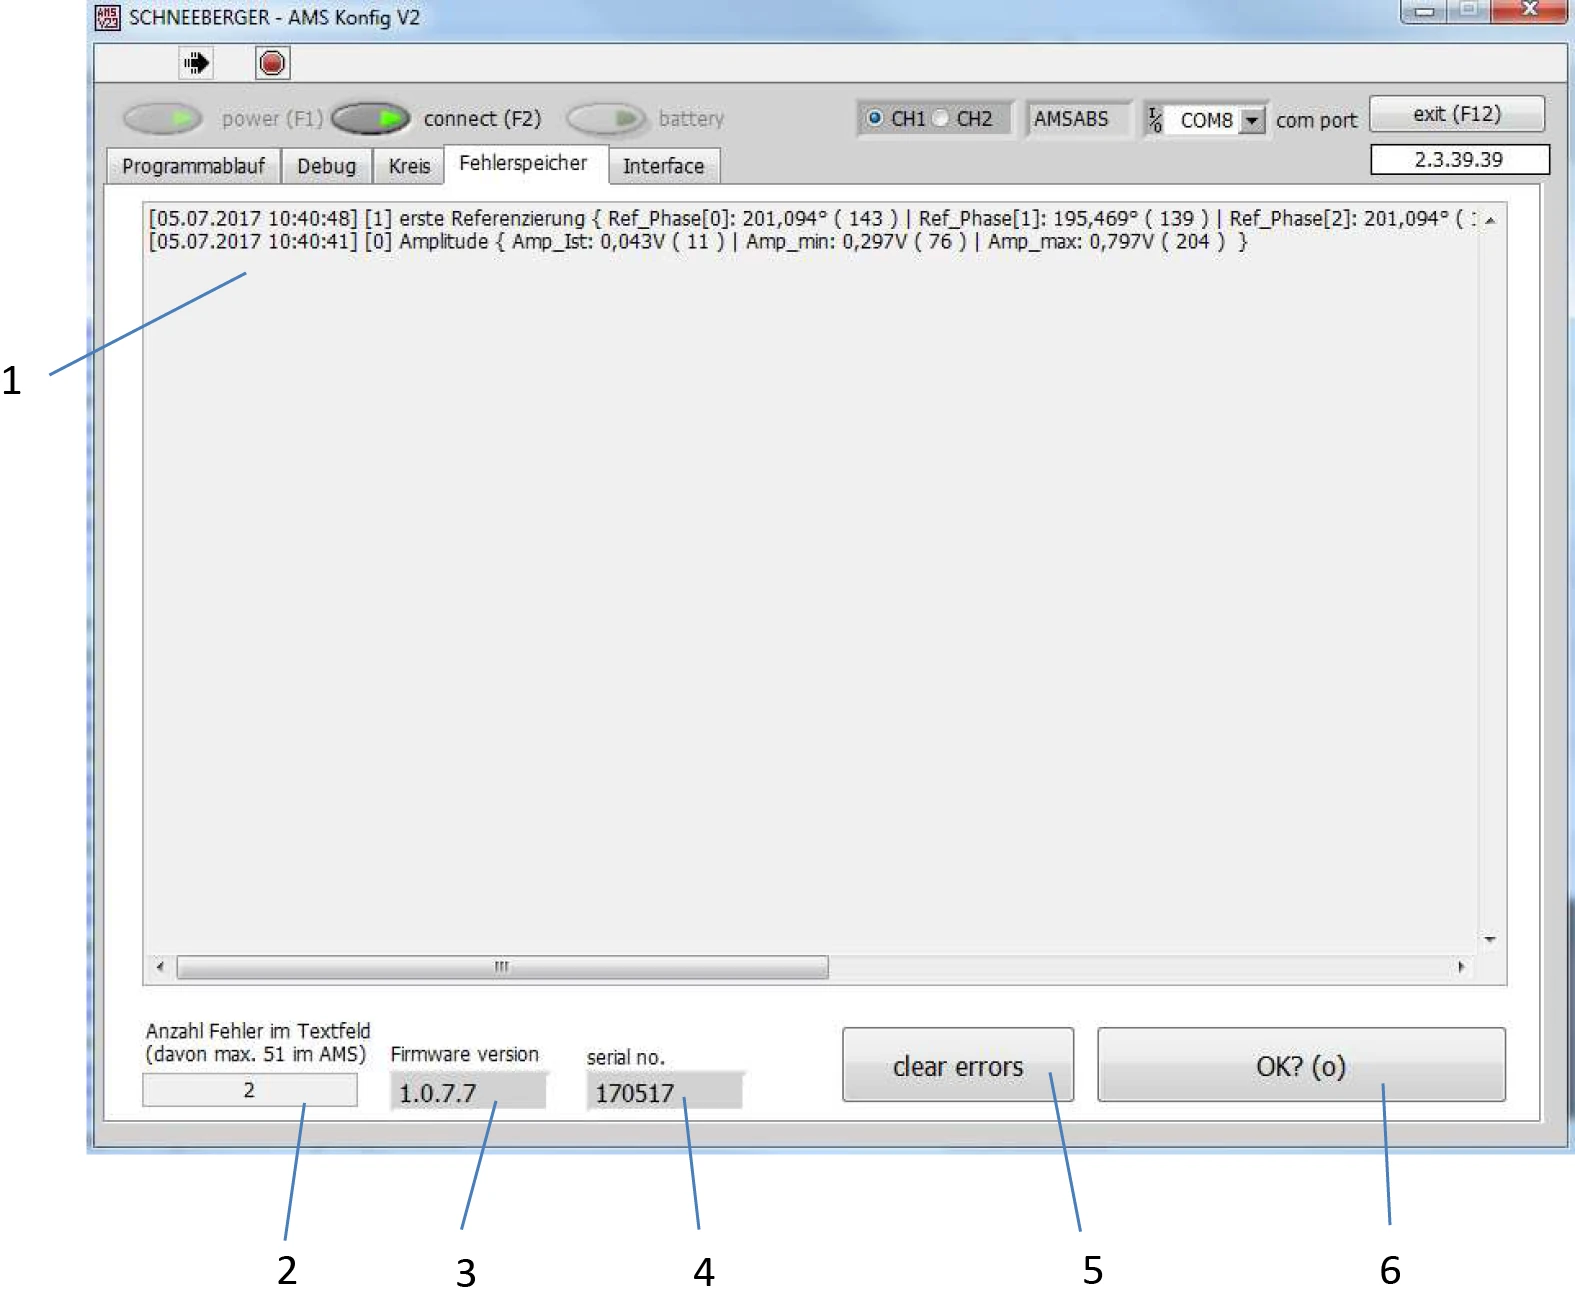
Click the Error Memory tab. For program version 1.0.7.7 and earlier, entry (1) is marked with the current date.
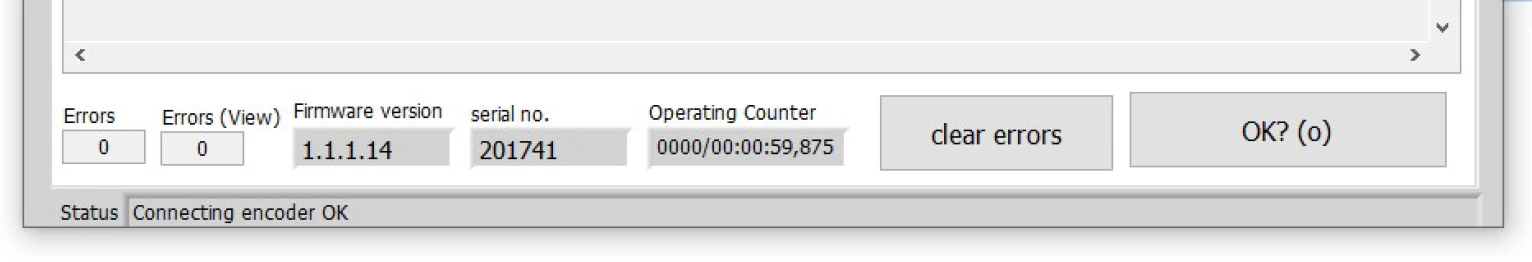
From version 1.1.1.14 onwards, each error entry displays a running counter. The information is shown in the format of days/hours, minutes, seconds.
The most recently recorded event is displayed at the top. Field (2) shows the number of entries in the error memory. The Clear Errors button (5) can delete entries. Records can be exported via button (6).
Entries in the memory can be selected and copied as text.
Field (4) shows the serial number of the measuring system, and field (3) shows the program version.
The limit values listed in the interface tab are continuously monitored, and any exceedance is recorded in the error memory.
When the read head is installed on the guide rail, an initial reference message is issued.
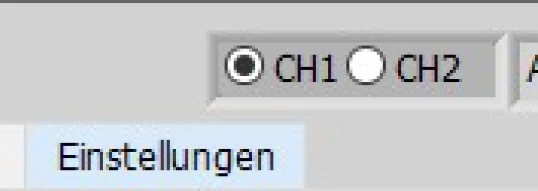
Special feature: For read heads with Drive Cliq interface, channels 1 and 2 each have their own independent error log. You can switch between them by clicking CH1 or CH2.
Typical Messages and Their Meanings
| No. | Message | Description |
|---|---|---|
| 1 | First Reference | Assembly message when the read head is installed on the guide rail |
| 2 | New Reference | A new reference mark was found (follow-up message to item 1) |
| 3 | Battery | Battery error, battery replacement required. Error message is sent to the controller |
| 4 | Sensorvoltage | Possible amplitude error, distance between sensor and scale is not ideal. No error message is sent to the controller |
| 5 | No Scale | The read head does not detect a guide rail signal. Error message is sent to the controller |
| 6 | Amplitude | Amplitude error. Error message is sent to the controller |
| 7 | Absolutposition | Error in the absolute track. Error message is sent to the controller |
6.1.2 Reading and Changing the Read Head Interface
In this interface, you can query or change the configured interface, as well as read the current position of the measuring system (green-bordered field).
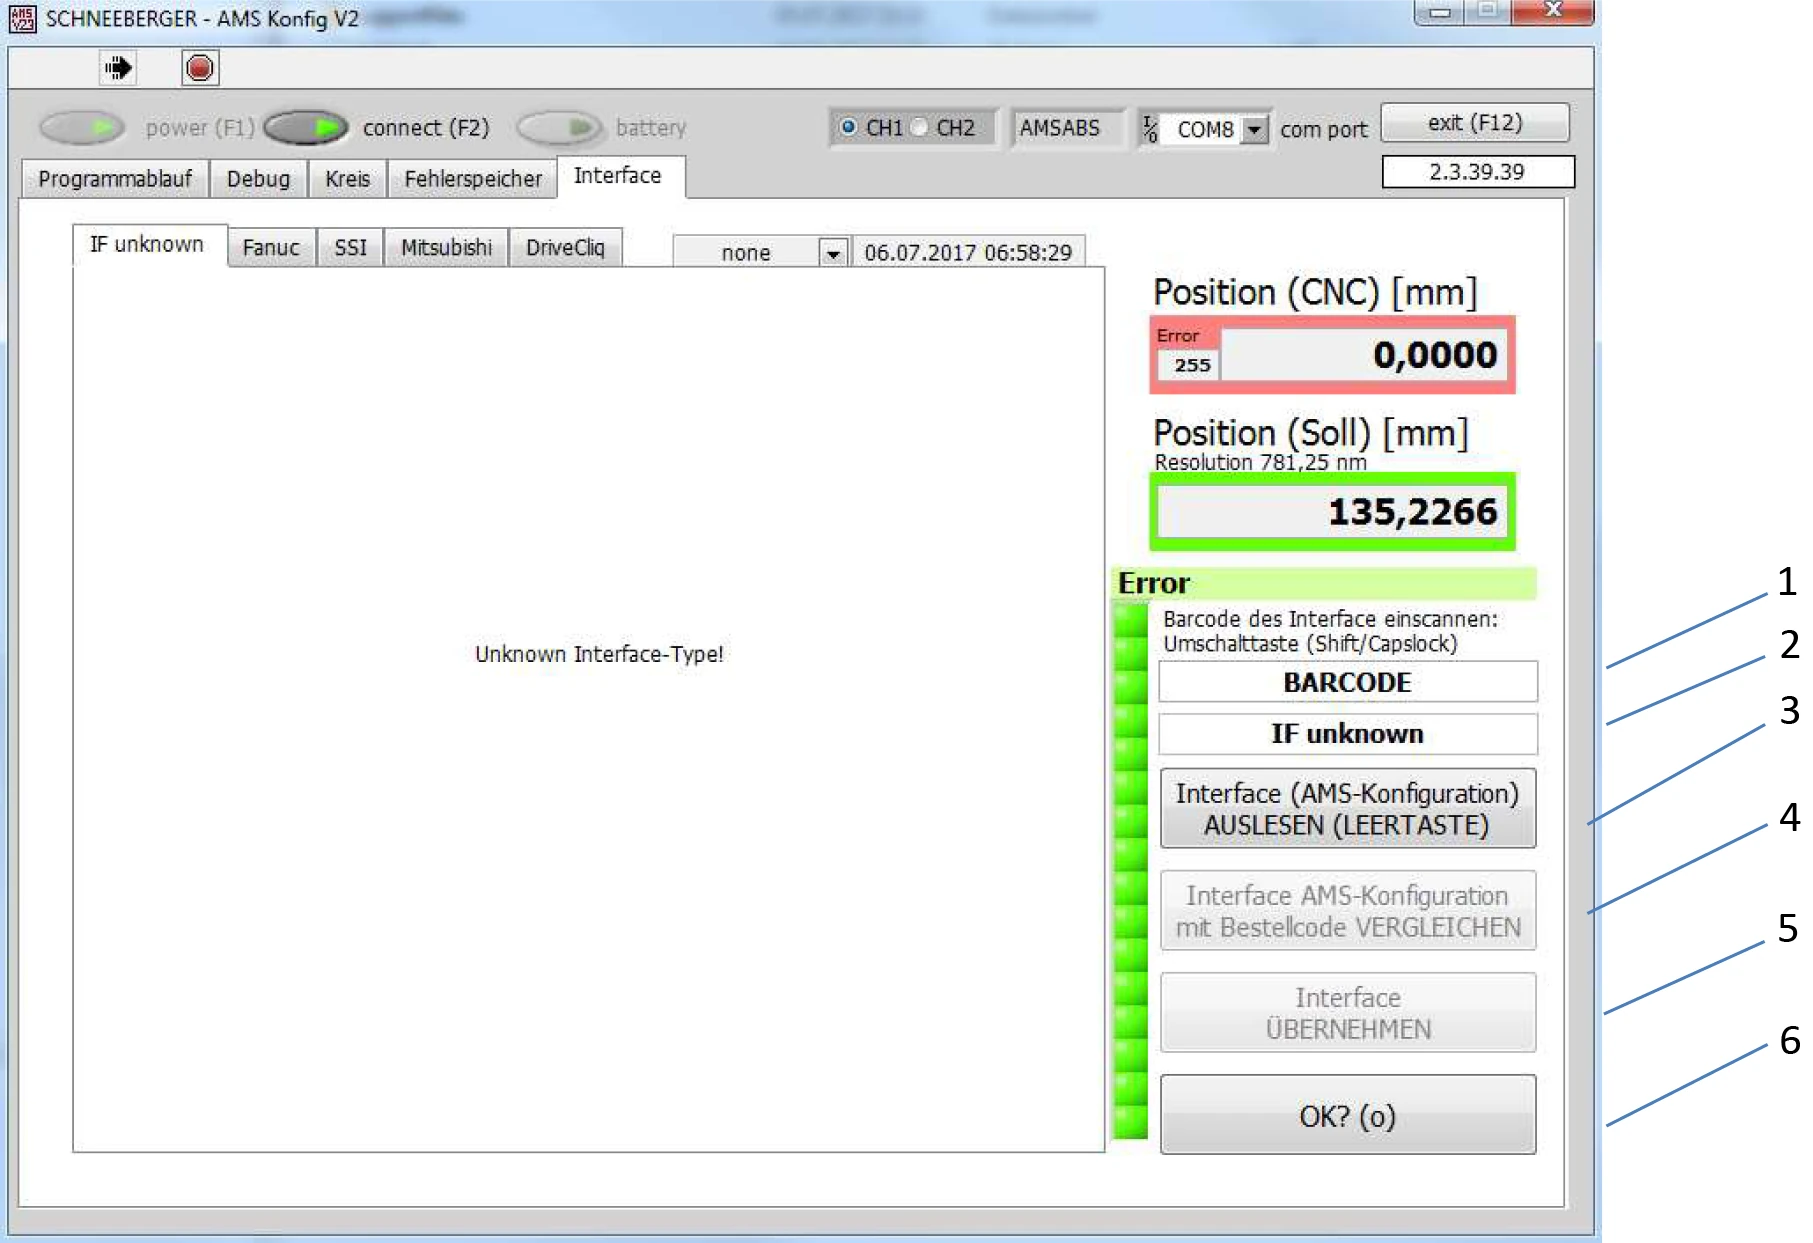
The OK button (6) allows you to jump to the program flow tab.
The functions of fields 1 and 4 are disabled.
After pressing the Interface button (3), the screen switches and displays the interface settings.
Field 2 shows the current interface.

The desired interface can be selected in this row.
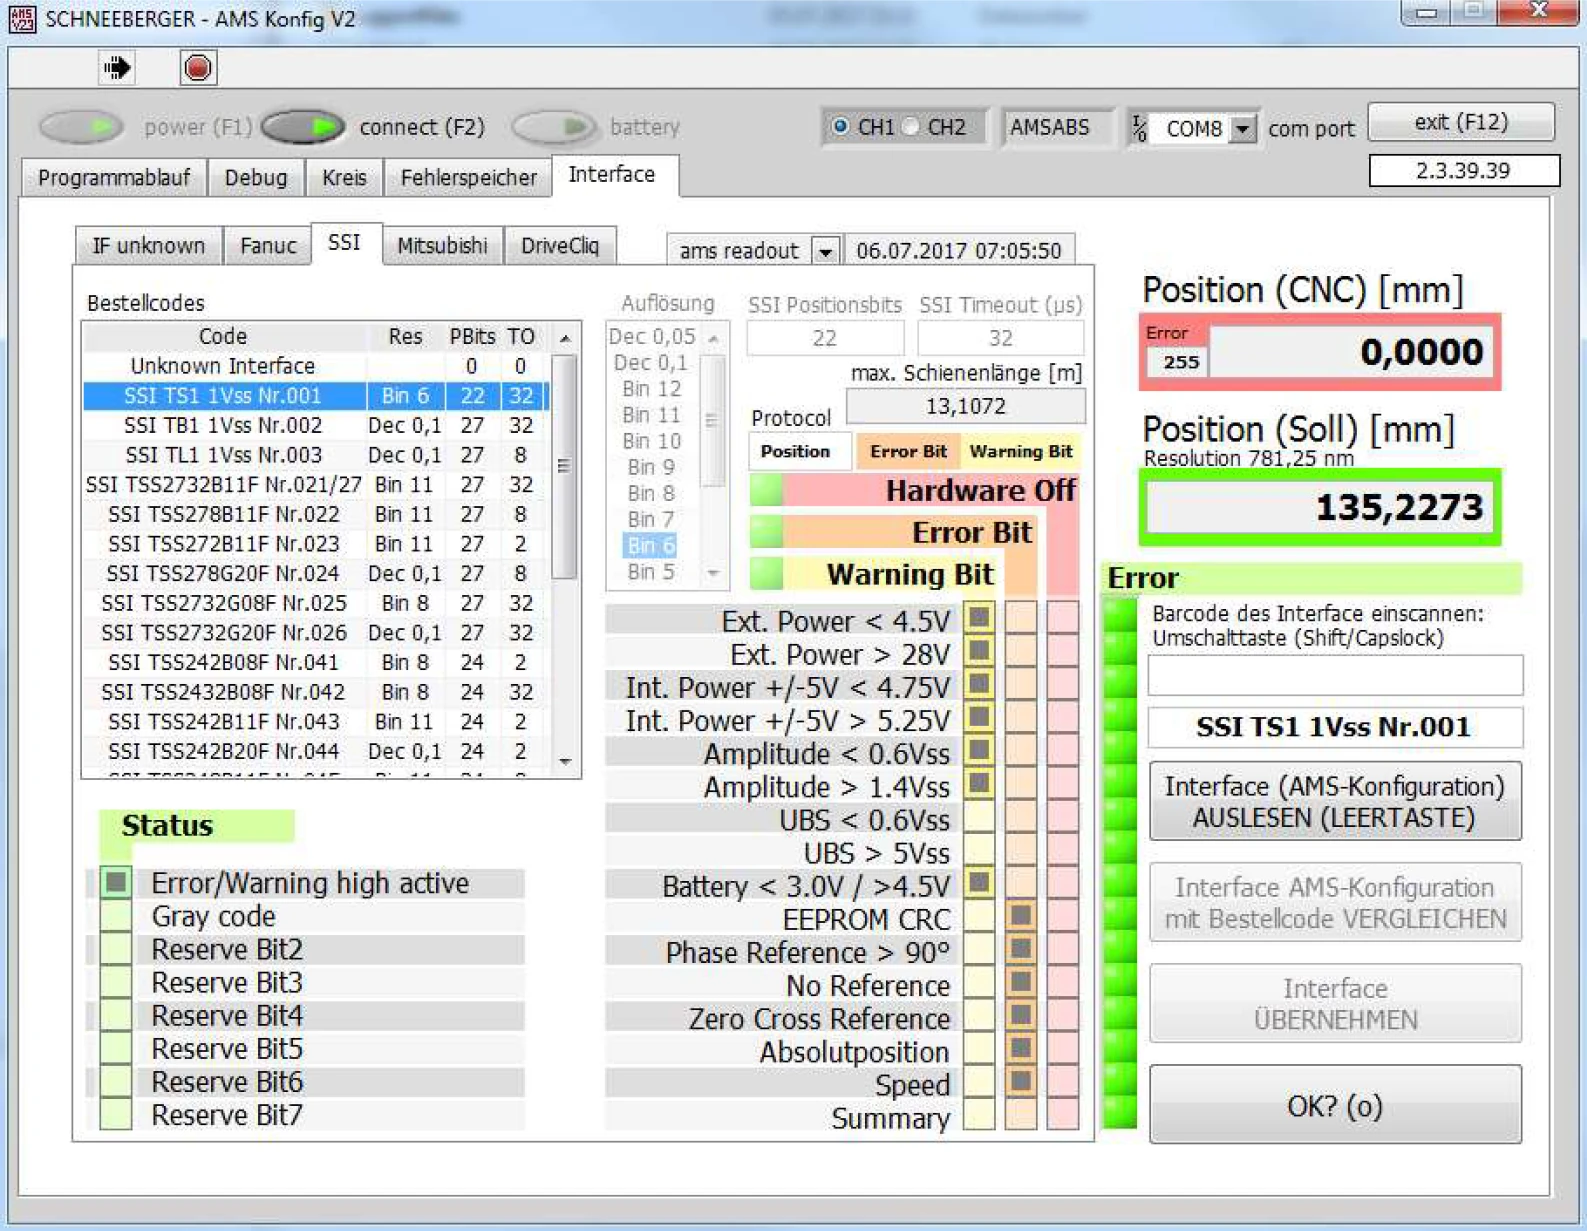
After selecting the desired settings, press Interface apply (5).
In this example, the TS1 interface is used for Siemens solution line products, with Siemens sensor modules SME or SMC.
It is also possible to read the linked records in the error memory, as well as the status of error/warning bits forwarded to the controller.
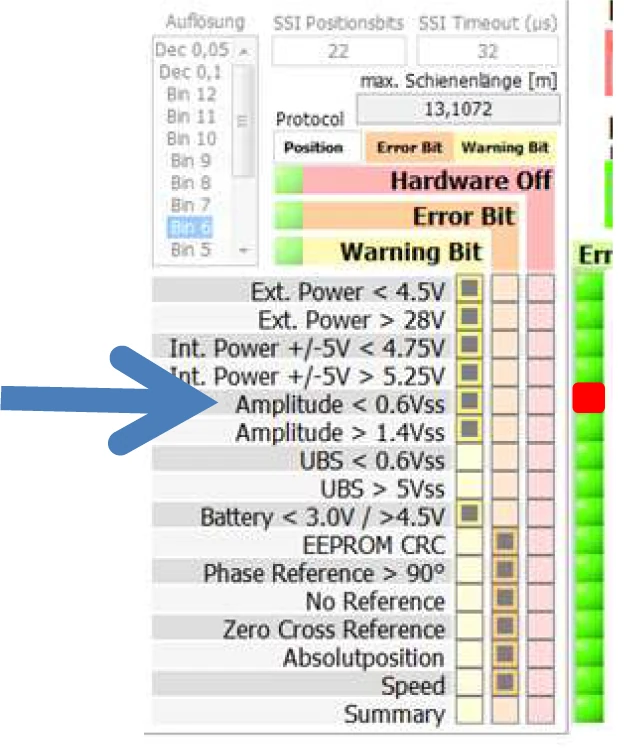
Example 1: Amplitude Error
When an amplitude error occurs, the error is displayed in the error memory and a warning bit is sent to the controller.
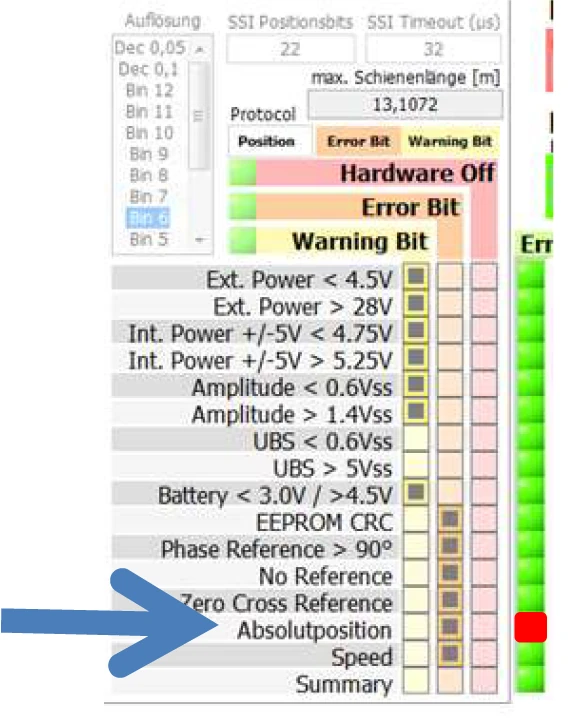
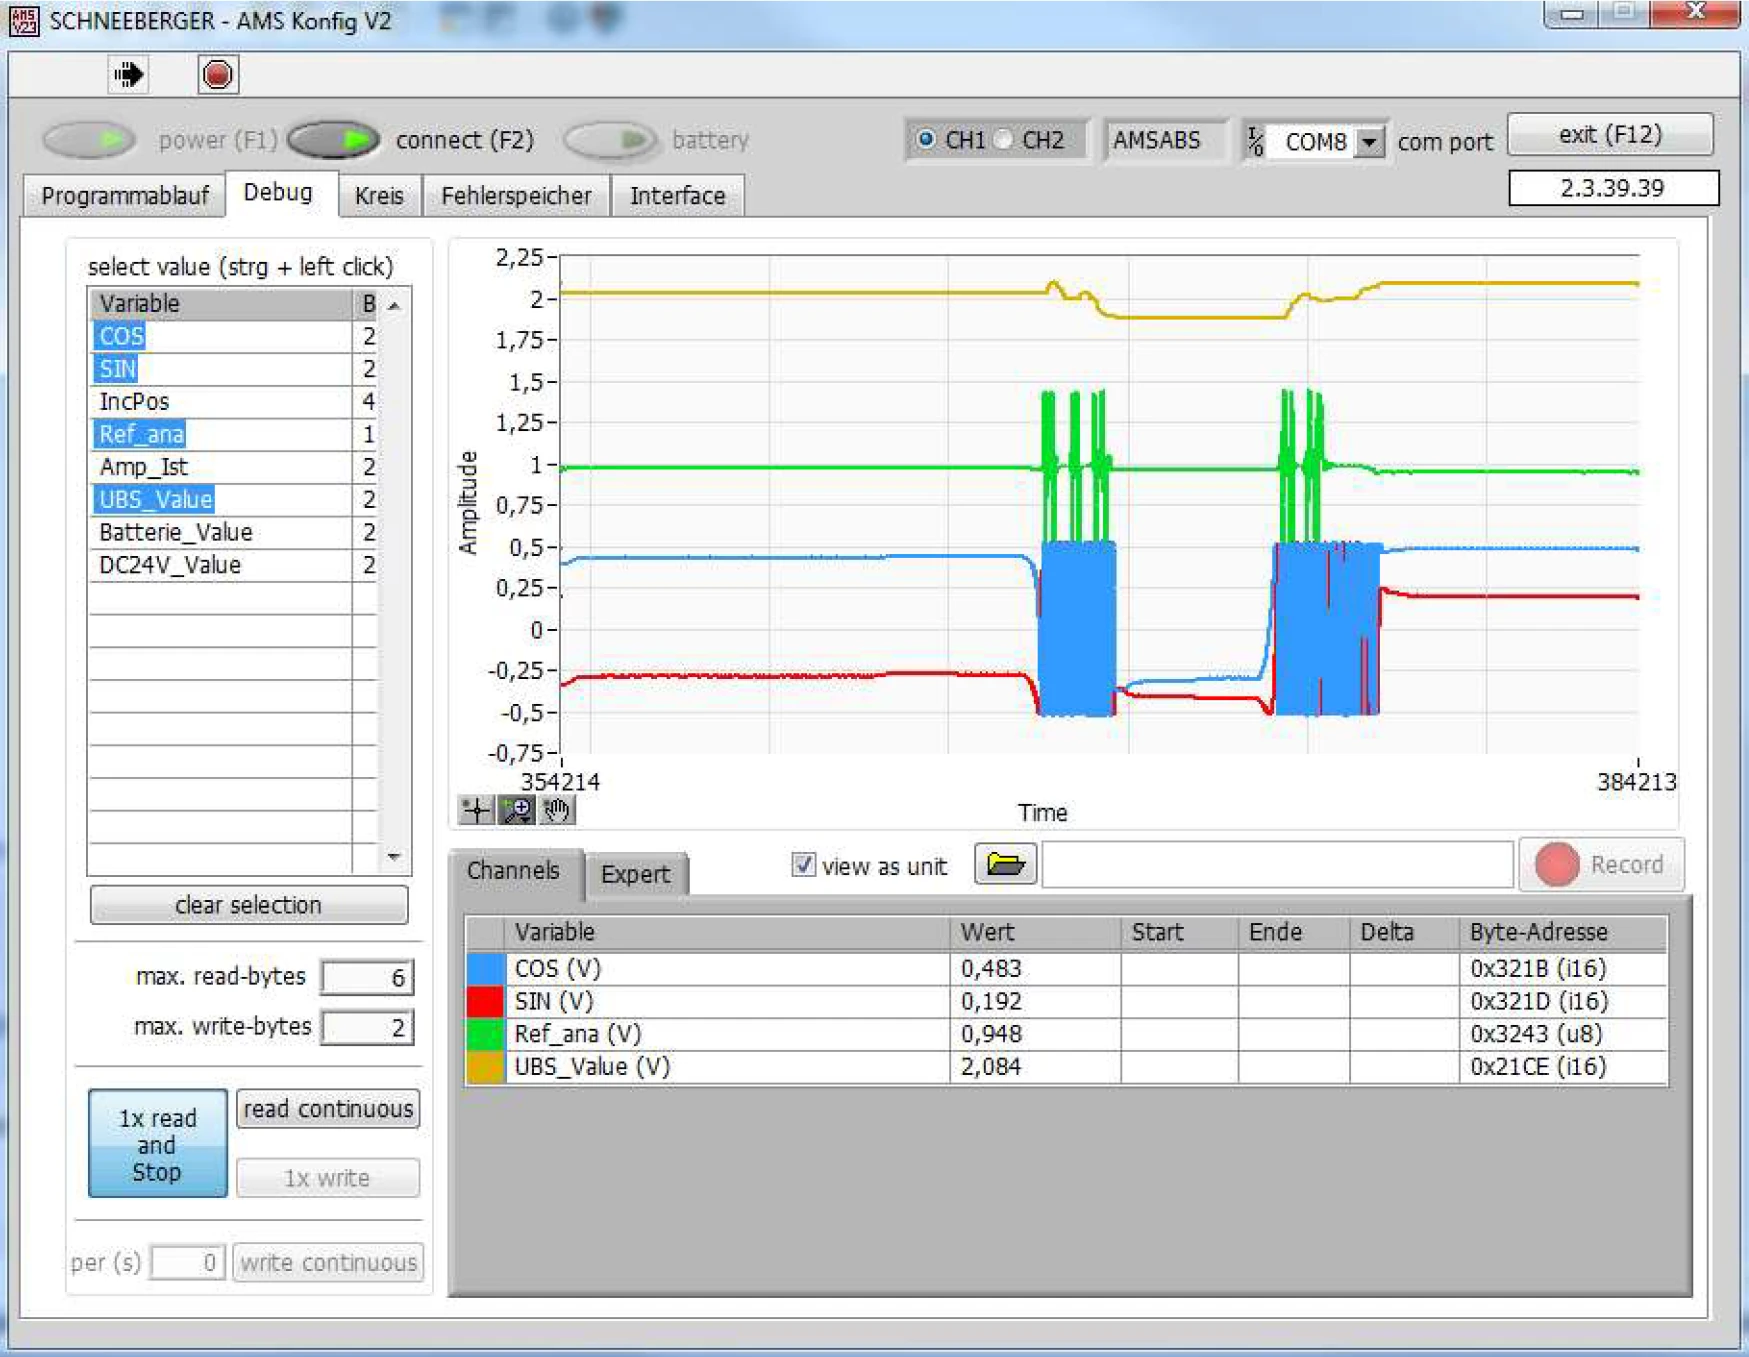
Example 2: Absolute Channel Error
When an error occurs in the absolute channel, the error is displayed in the error memory and an error bit is sent to the controller.
6.1.3 Watching Read Head Signals
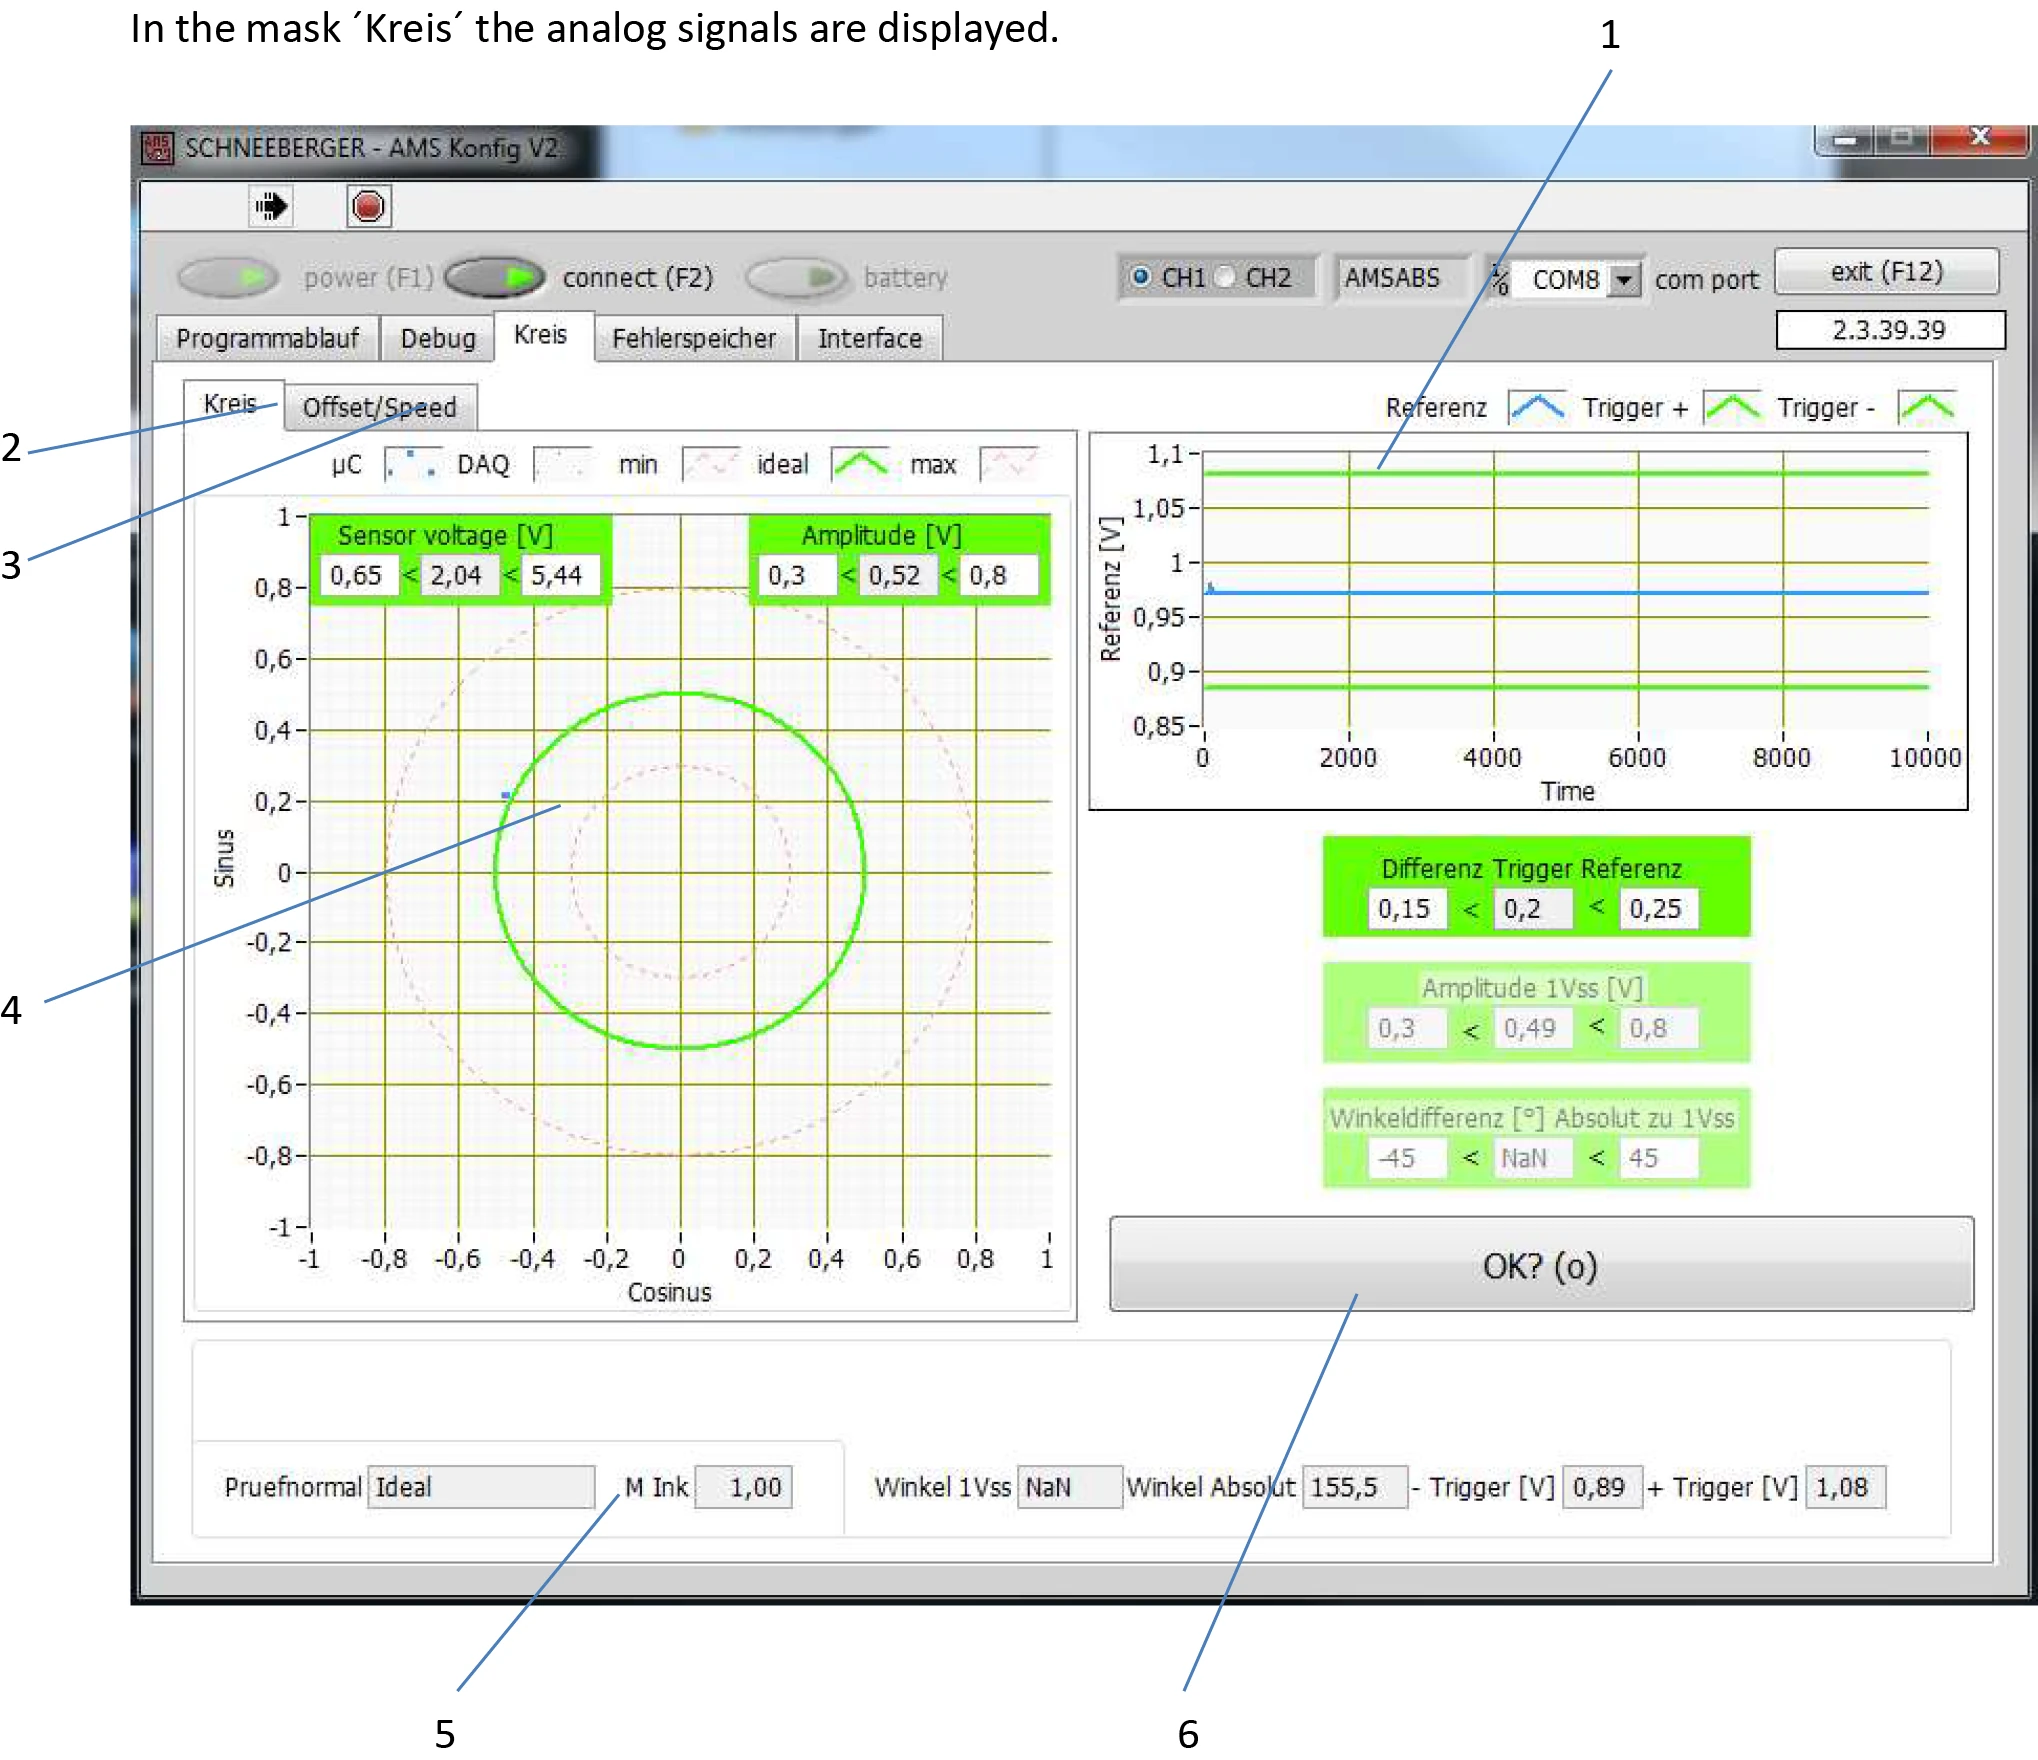
The analogue signals are displayed in the "Kreis" (Circle) interface.
At standstill, the current measured values (4) of sine and cosine are displayed as a point. During motion, the measured values move along the green circle. Ideally, the point should move on the green circle.
During motion, the analogue reference value of the absolute track is displayed in field 1.
The bar field (5) at the bottom has no function.
The OK button (6) allows you to jump to "Programmablauf" (Program Flow).
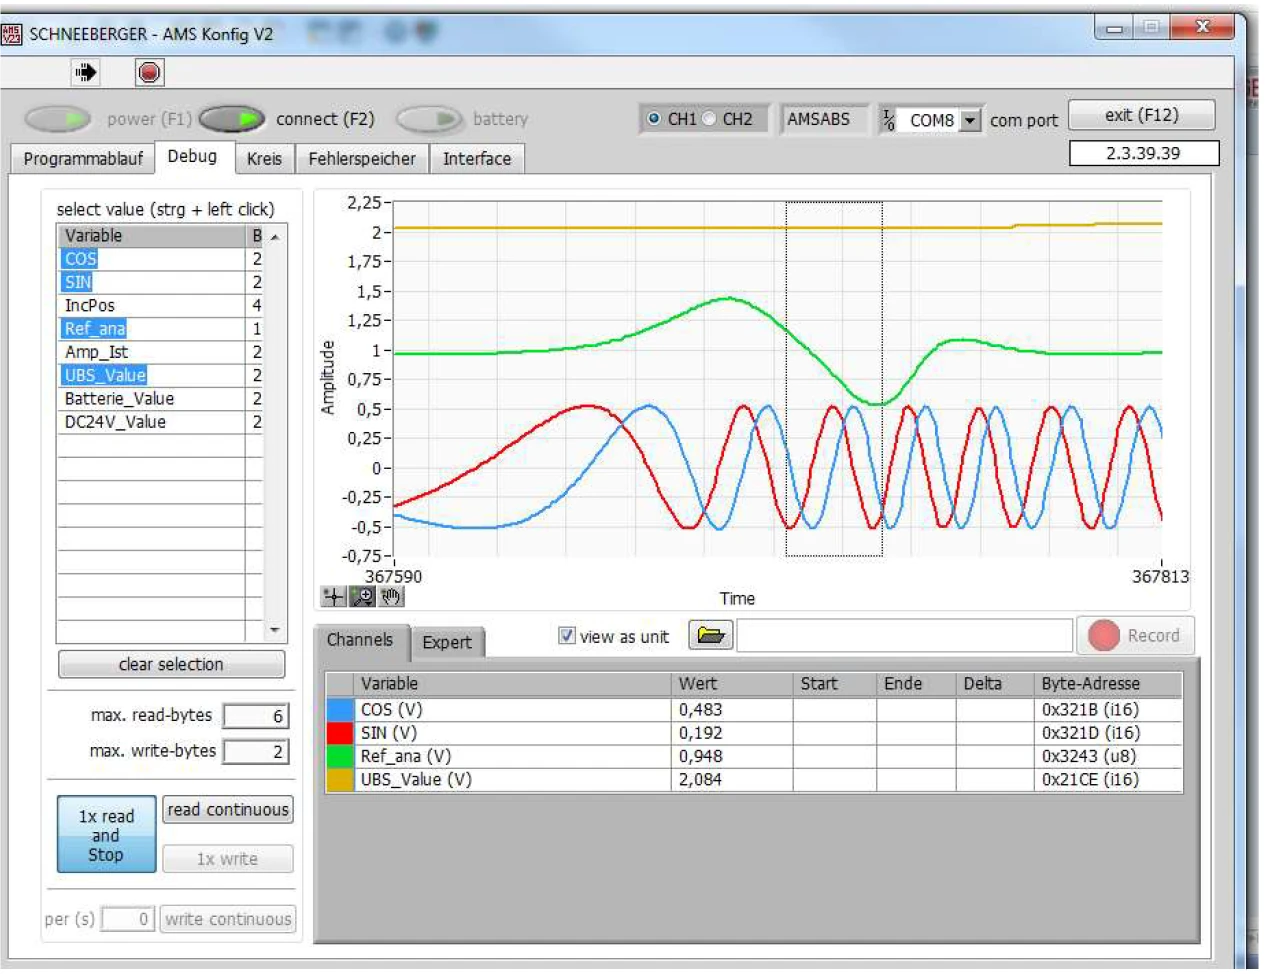
6.1.4 Recording Read Head Signals
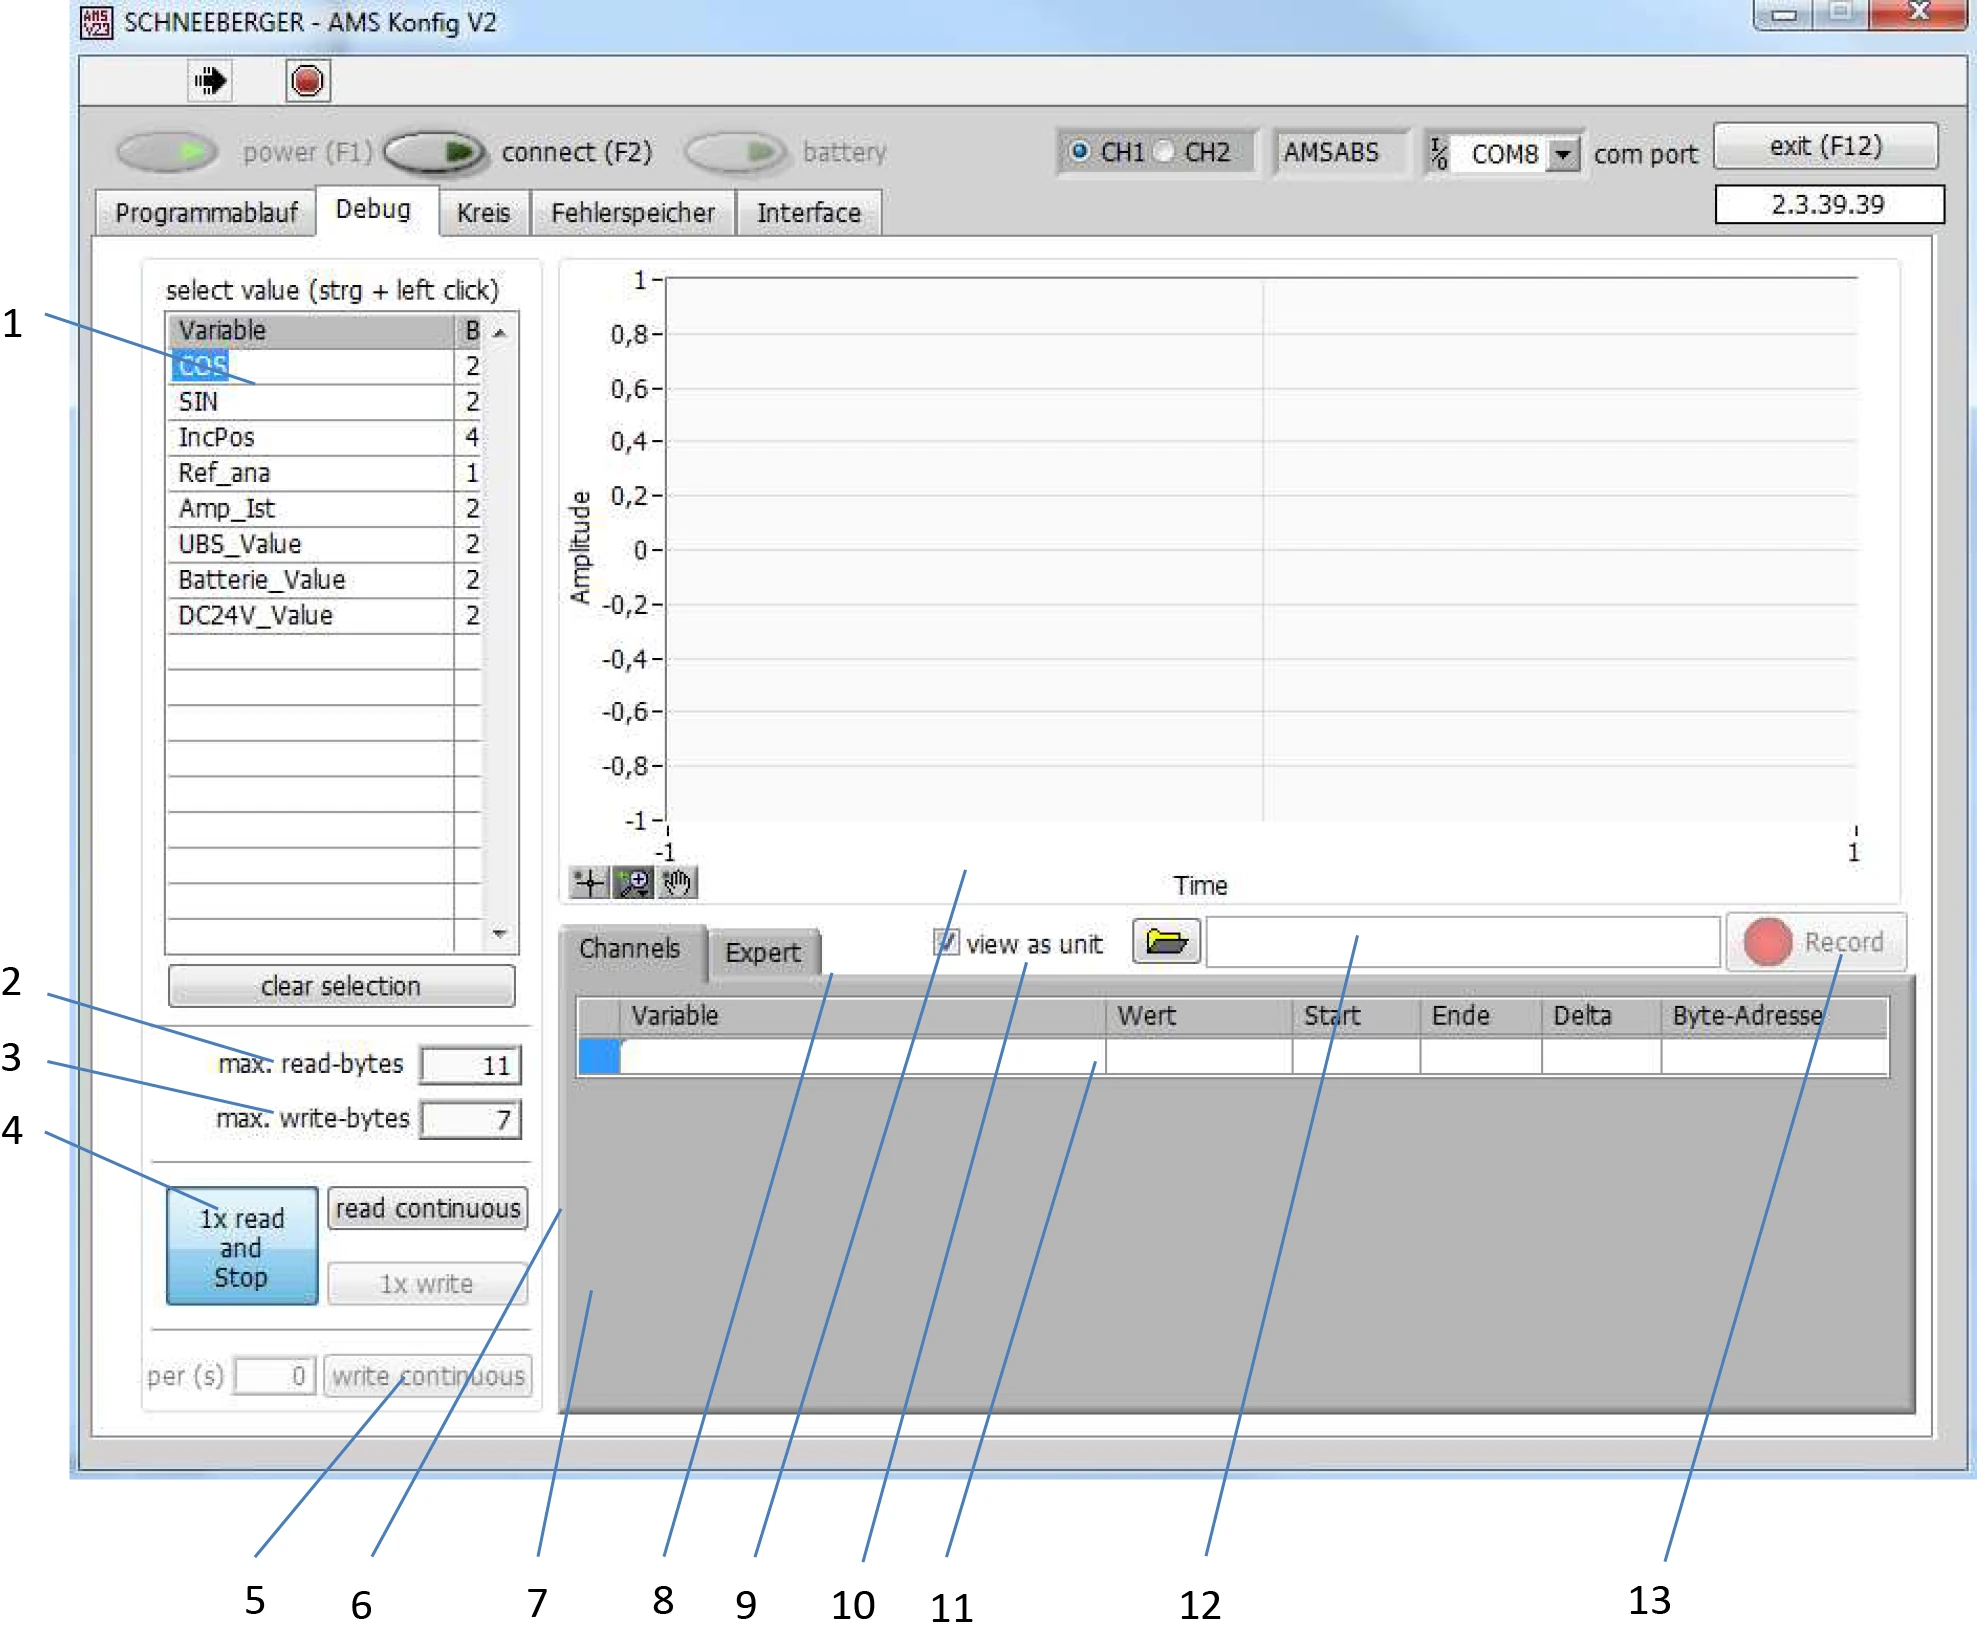
The Debug tab is equipped with an oscilloscope function. The desired variables can be selected in field (1).
Available Variables
| Variable Name | Description |
|---|---|
| Cos | Cosine 1 Vpp |
| Sin | Sine 1 Vpp |
| IncPos | Absolute position (resolution = 781.25nm) |
| Ref_ana | Reference signal (analogue) |
| Amp_Value | 1Vpp/2 (sine, cosine) |
| UBS_Value | Sensor power supply voltage |
| Batterie_Value | Battery voltage |
| DC24V_Value | Read head power supply voltage |
A maximum of 5 variables can be output simultaneously. Hold the CTRL key and click with the mouse to select multiple variables.
The selected variables are displayed in field 11, along with their corresponding color coding.
Press read continuous (6) to start recording data in field (9). Press 1x read and stop (4) to stop recording.
Advanced Settings (Expert)

Trigger thresholds can be modified here.
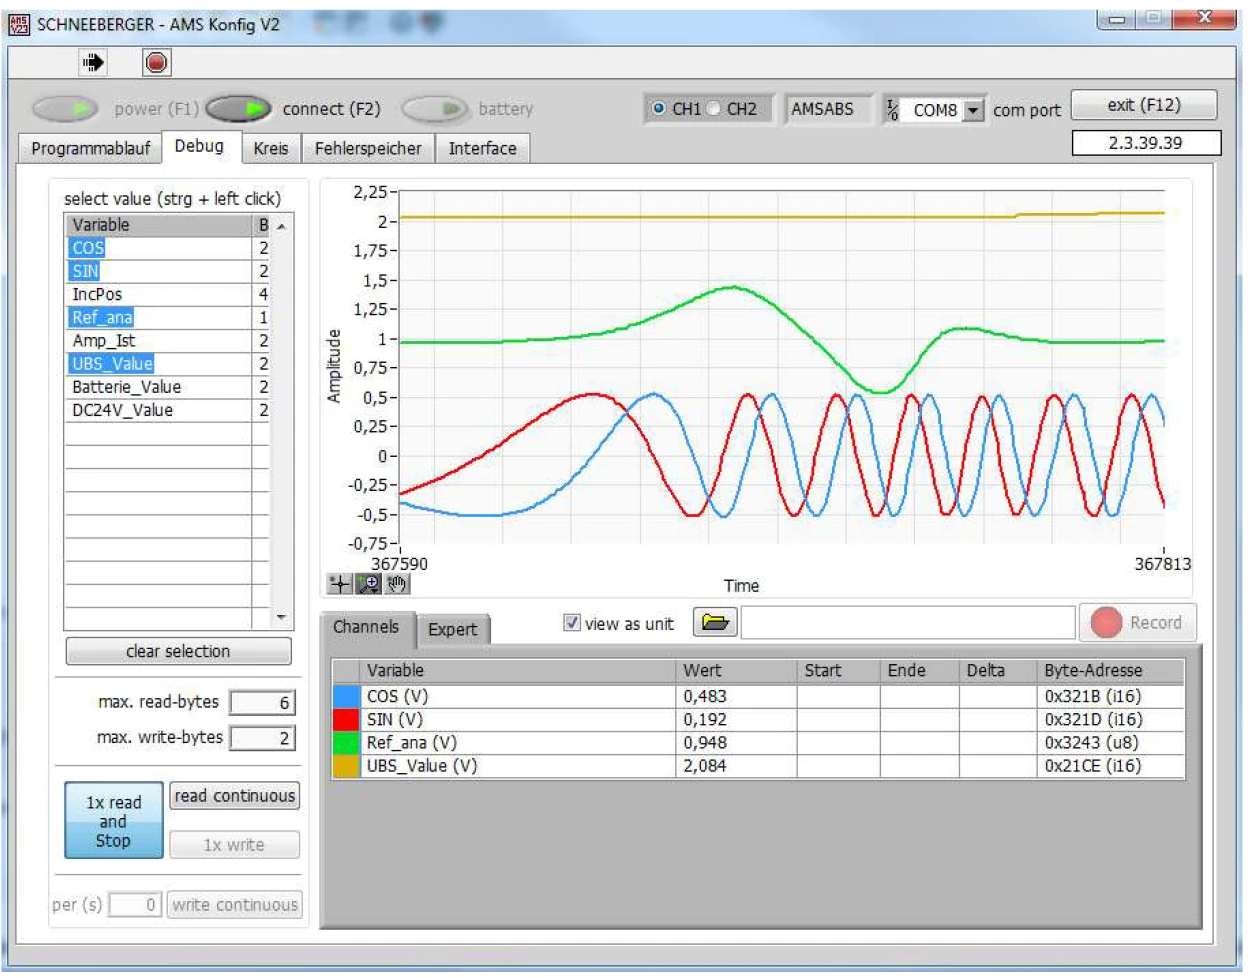
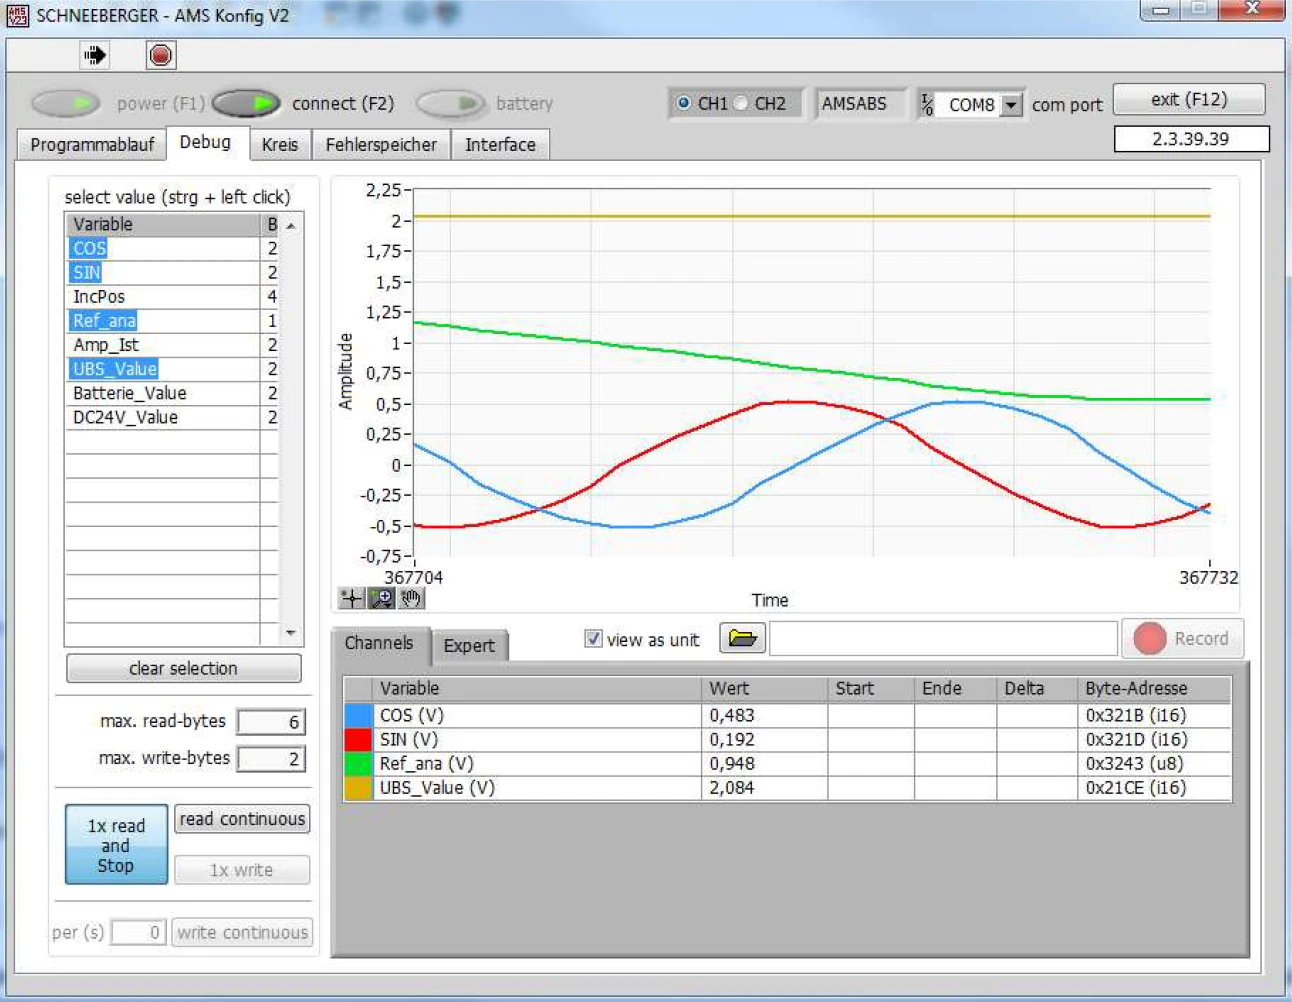
Zoom Function
The display area at the bottom left provides a zoom function.

Use the mouse to select the magnifying glass and position it on the area you want to zoom into.
Data Export to Excel
Measurement data can be saved as an Excel file. Select the save location and file name in field (12), then start or stop recording.
Before starting data recording, the read continuous (6) button must be pressed first.
It is recommended to also select the IncPos variable, as the position information of the read head will also be saved (this position may differ from the position displayed on the machine).
The file can be opened and edited with software such as Microsoft Excel.
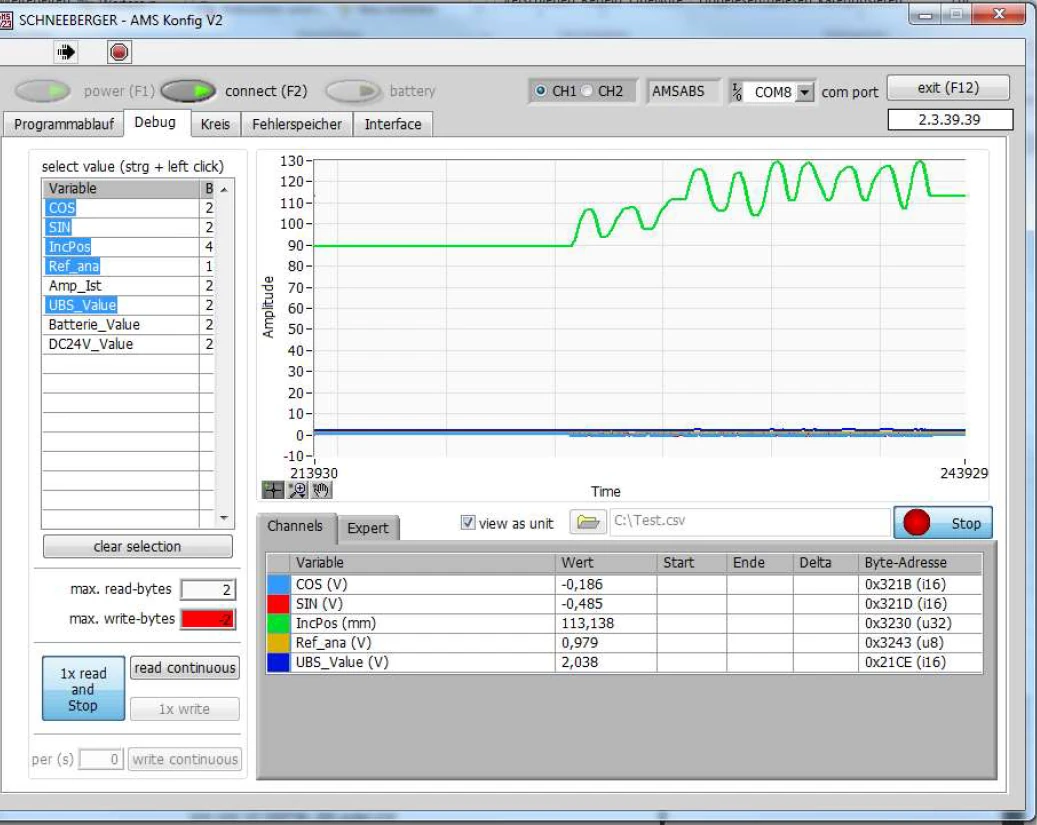
Data recording has started.
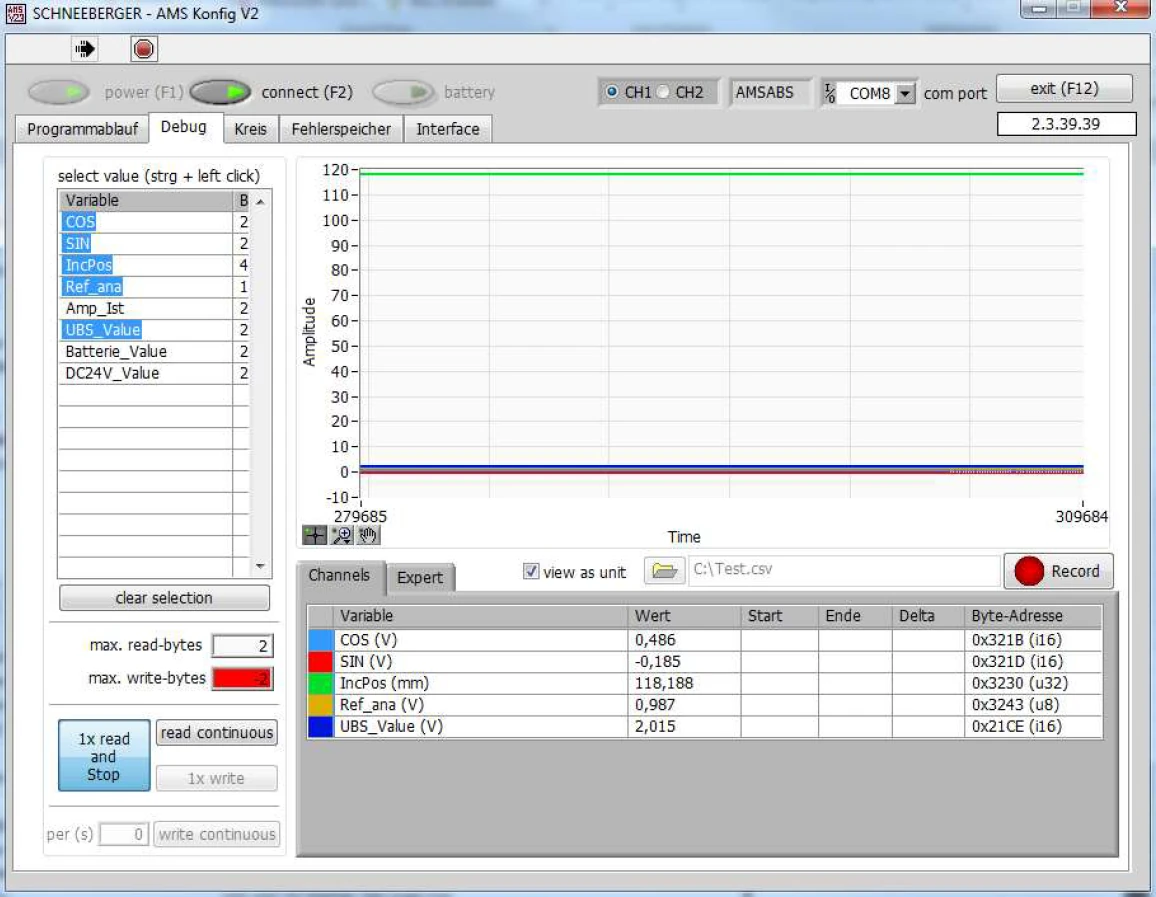
Stop data recording.
6.1.5 Program Flow (Programmablauf)
Warning: Operations in this interface may only be performed with the machine switched off. See section 6.2.1.
The read head must be disconnected from the machine's power supply!
Note: Failure to observe this warning may result in personal injury and machine damage.